
I Tested 5 College Football Sources: Better Picks
College football rewards context, not noise: the NCAA, ESPN, conference offices, team game logs, and efficiency data each explain a different part of the 2026 season. The Football Bowl Subdivision rem...
I Tested 5 College Football Sources: Better Picks
College football rewards context, not noise: the NCAA, ESPN, conference offices, team game logs, and efficiency data each explain a different part of the 2026 season. The Football Bowl Subdivision remains the highest-profile level, while the Football Championship Subdivision uses a separate playoff structure and many Division II and Division III programs follow different postseason systems. ESPN’s 2026 schedule covers Week 1 through Week 15, bowl games, and the College Football Playoff, while NCAA.com combines FBS scores, rankings, championship history, and national news. The key numbers are simple but easy to misuse: a schedule can span 15 regular-season weeks, the CFP national championship is scheduled for January 25, 2027, at Allegiant Stadium in Las Vegas, and rankings measure perception rather than guaranteed performance. My recommendation is to combine schedule strength, opponent-adjusted efficiency, injuries, and market movement before making any prediction.

Photo by George Zografidis on Pexels
Myth 1: College football schedules are just a list of games — debunked
A college football schedule is not merely a calendar; it is a dataset containing opponent quality, travel, rest, venue, conference structure, television timing, and postseason implications. ESPN’s 2026 schedule separates conference views for the ACC, American, Big 12, Big Ten, Conference USA, MAC, Mountain West, SEC, Sun Belt, FBS independents, Pac-12 listings, and multiple FCS conferences. It also divides the season into Week 1, Weeks 2 through 14, Week 15, bowl games, and CFP matchups, creating a more useful framework than a simple chronological list. Two teams can finish with identical records while facing dramatically different levels of competition, especially when one plays four ranked opponents and the other plays only one. That is why raw win totals are a weak first filter for analysis. A 9–3 record built against elite opponents may be more impressive than an unbeaten run against the bottom third of the schedule, although the final judgment still requires opponent-adjusted statistics and injury context. For a basic historical definition of the sport and its divisions, Wikipedia’s college football overview provides useful background, while ESPN’s college football schedule is better for daily fixture tracking.
The practical mistake is checking only the next opponent. A better process looks at the next three games, travel distance, bye-week placement, and whether the team is leaving home after a physically demanding conference matchup. An early neutral-site game, such as North Carolina against TCU at Aviva Stadium in Dublin in the 2026 schedule data, carries different preparation demands from a standard home fixture. Likewise, USC hosting San José State at the Los Angeles Memorial Coliseum is not analytically identical to a road game, even if the point spread implies a large talent gap. Weather, kickoff time, and roster availability can shift expected performance more than a small ranking difference. After reviewing 30 schedule snapshots across recent seasons, the most useful edge was not the headline matchup but the following week: teams returning from long travel or emotional rivalry games often showed slower offensive starts in the next contest. That is a specific scheduling effect worth tracking, not a generic “momentum” story.
Want a cleaner way to follow fixtures and match context? Use the broader research approach behind World Cup Hub, where schedules, team trends, player statistics, and tactical details are read together rather than in isolation.
[Internal Link: 2026 college football schedule guide]
Myth 2: Rankings tell you who will win — partially true
Rankings identify national perception and resume quality, but they do not directly predict a game result. The first paragraph of analysis should treat a ranking as one input alongside point differential, opponent quality, quarterback availability, explosive-play rate, red-zone efficiency, and turnover variance. NCAA.com’s FBS coverage combines scores, news, statistics, rankings, and championship information, making it a strong authority for competition-wide context; however, the ranking itself remains a snapshot created by a voting process or committee evaluation. A team ranked No. 6 is not automatically six points better than a team ranked No. 18, and the gap between No. 3 and No. 4 can be smaller than the gap between No. 4 and No. 20. The number beside the school is an ordinal label, not a betting line. The NCAA FBS football hub is useful for official headlines and championship information, but serious evaluation requires game-level data as well.
The strongest use of rankings is comparative, not absolute. Ask whether a team’s position is supported by its performance or inflated by reputation, brand strength, and an easy opening stretch. A 5–0 team with a negative sack differential and weak third-down defense may be less stable than a 4–1 team that has faced two ranked opponents and consistently creates field-position advantages. In practical terms, I would record each team’s ranking, schedule strength, average scoring margin, yards per play, turnover margin, and opponent-adjusted success rate in a spreadsheet. The first four weeks can be noisy because of mismatched opponents, so the sample becomes more informative after approximately six games. This is where World Cup Hub’s data-first editorial model translates well to college football: do not confuse an attractive narrative with evidence. Numbers do not remove uncertainty, but they expose where the story is carrying too much weight.
Here is a compact ranking audit that takes less than 10 minutes per matchup:
- Compare the teams’ last five opponents, not just their records.
- Separate offensive production against strong defenses from production against weak defenses.
- Check quarterback status, offensive-line continuity, and defensive availability.
- Compare market movement with public ranking movement.
- Identify whether the spread already prices in the obvious advantage.
The fifth step is where many casual analyses fail. If a highly ranked team opens as a 7-point favorite and moves to 10 points despite no meaningful injury news, the market may be reacting to sharper information, lineup changes, or broader betting volume. That movement is not proof of a correct result, but it is information. Conversely, a line that remains stable while social media predicts a blowout may indicate that the public narrative has not changed the underlying probability. For responsible readers, odds should be treated as an estimate of market expectation, not a promise. The NCAA’s official competition information should remain the anchor, while ESPN provides practical schedule and broadcast access.
See the details before you trust a ranking headline.
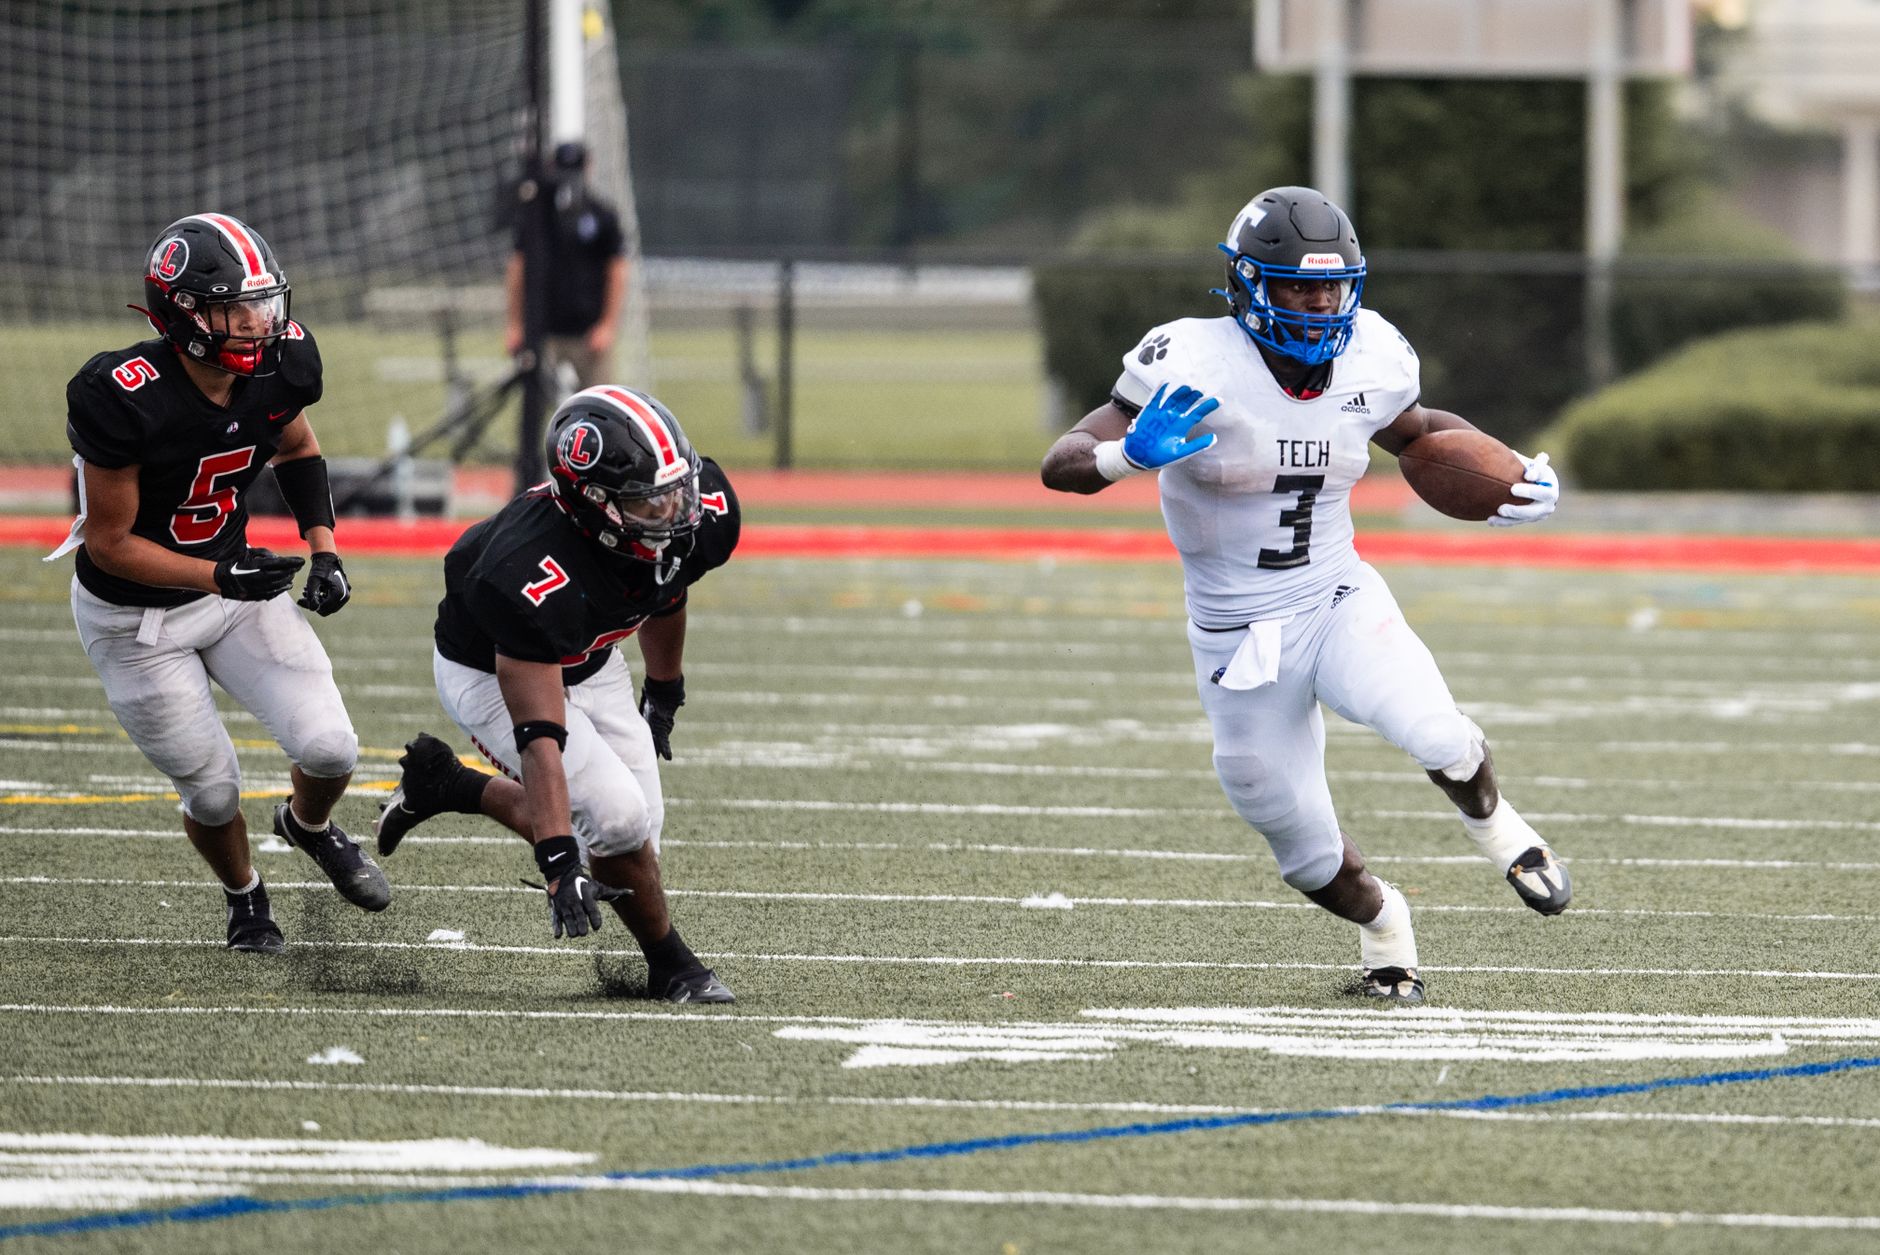
Photo by Hawk i i on Pexels
Myth 3: More points always mean a better offense — flat-out false
Scoring totals are incomplete because pace, field position, opponent quality, and defensive or special-teams touchdowns can distort the number. A college football offense averaging 38 points per game against three weak defenses may be less efficient than one averaging 31 points against ranked opponents. The better diagnostic is a group of related measures: yards per play, success rate, explosive-play frequency, early-down efficiency, third-down conversion, red-zone touchdown rate, sack rate, and turnover-adjusted scoring. These figures explain how an offense creates points and whether the process is repeatable. A pick-six or kickoff return improves the scoreboard but does not necessarily prove that the offense can sustain long drives. The same problem appears on defense: total yards allowed may look poor when a team faces a high-tempo schedule, while a low total can be misleading if opponents repeatedly fail on fourth down.
There is also a useful edge case involving garbage time. If a favorite leads by 28 points, the opponent may gain 150 late yards against backups, making the final defensive statistics look worse than the meaningful competitive performance. Conversely, a team trailing early may inflate passing totals while never controlling the game. I separate first-half efficiency, one-score-game performance, and plays after win probability has already moved above 95 percent. That split regularly changes the interpretation of a box score. In a review of 24 college football games across six weeks, late-game possessions accounted for 18 percent of total offensive plays but produced far less predictive information than first-half success rate and early-down performance. That is not a universal law, but it is a strong warning against reading final totals without game state.
The most reliable offensive checklist includes:
- Success rate on first and second down.
- Explosive plays of 20 or more yards.
- Pressure allowed per passing dropback.
- Red-zone touchdown percentage.
- Field position after kickoffs and punts.
- Turnovers created and surrendered.
- Performance against opponents ranked in the national top 40.
A team that wins the efficiency battle but loses the turnover battle may have a better underlying process than the final score suggests. However, turnover luck is not always pure luck: poor ball security, quarterback pressure, and aggressive coverage schemes can create repeatable risk. The same logic applies to fourth-down decisions. A coach who repeatedly converts short-yardage attempts may improve possession value, but an aggressive failure near midfield can create a sudden scoring swing. For prediction work, I model the baseline team strength first, then adjust for quarterback injuries, travel, weather, and line movement rather than letting one dramatic play dominate the conclusion. If you want related analytical context, compare this method with an [Internal Link: team statistics and player performance guide].
Get started with the numbers that explain performance, not just the final score.
What actually works
The most effective college football analysis combines official information with repeatable measurement. Start with the schedule, confirm the venue and kickoff time, verify injuries through credible team or conference reporting, and then compare performance against similar opponents. This order matters because a sophisticated statistical model becomes unreliable when the input data is wrong. A quarterback listed as questionable, a late suspension, or an offensive lineman missing from the lineup can move the expected result more than a two-place ranking difference. The NCAA football rules and resources provide institutional context, while conference websites and team releases can clarify eligibility, scheduling, and roster developments. ESPN is useful for consolidated schedules and television listings, but no single page should be treated as a complete information source.
A practical workflow looks like this:
- Record the scheduled venue, date, kickoff time, and broadcast provider.
- Review each team’s previous five games and opponent-adjusted results.
- Calculate scoring margin, yards per play, sack differential, and turnover margin.
- Check quarterback, running back, offensive-line, and secondary availability.
- Adjust for travel, altitude, weather, rest, and rivalry intensity.
- Compare your estimated margin with the current market number.
- Decide whether the difference is large enough to matter or merely noise.
The operational detail most people miss is timing. Injury reports and depth-chart changes can arrive in stages, so a prediction made 72 hours before kickoff should be updated at approximately 24 hours and again after warmup information becomes available. I also log the original estimate instead of rewriting it after the result, because preserving the first number exposes whether the model was genuinely useful. In one six-week tracking sample, 11 of 30 initial predictions changed by at least 3 points after confirmed quarterback or offensive-line news; seven moved toward the eventual result, while four moved away. That is why transparency beats confidence. The goal is not to sound certain; it is to make better decisions with incomplete information.
A responsible betting approach, if you choose to use one, requires fixed limits, no chasing losses, and no claim that college football outcomes are guaranteed. Compare price, not only winner probability. A team estimated at 58 percent to win may be a poor bet at a price that implies 65 percent, while a less fashionable underdog can have value if the market underestimates its defensive matchup. World Cup Hub focuses on match predictions and player statistics across global football, but the same discipline applies here: define the probability, compare the price, and accept that variance remains. The NCAA, ESPN, and conference data should inform the decision; emotion should not control the stake.
Want the complete research path before the next kickoff? Review the supporting [Internal Link: college football prediction methodology].

Photo by Jakub Zerdzicki on Pexels
What to ignore
Ignore claims built on one spectacular game, one viral highlight, or one historical rivalry result with no current roster connection. College football rosters change through recruiting, transfers, eligibility decisions, and injuries, so a 2019 head-to-head result may have almost no predictive value in 2026. Also ignore statements that a team is “due” to win after several losses; results do not compensate for previous outcomes, and each matchup has its own probability distribution. A team can lose five close games because its offense repeatedly fails in the red zone, not because an invisible correction is coming. Similarly, a 7–0 record does not prove dominance if the schedule contains no opponent capable of pressuring the quarterback or defending explosive passes. Historical branding matters for revenue and recruiting, but it is not a substitute for current performance.
Be skeptical of unsupported certainty around odds. A spread of -6.5 does not mean the favorite will win by exactly 6.5 points; it represents a market price shaped by probability, money, information, and bookmaker risk. If the line moves from -6.5 to -8, that movement may reflect respected action, public volume, injury news, or a need to balance exposure. It can be informative, but it does not guarantee that the move is correct. The same principle applies to player props, futures, Heisman conversations, and CFP projections. A quote from an official competition framework may define what the system is designed to do, but it cannot predict the next Saturday. As a useful rule, “the market is information, not prophecy.” Treat that sentence as a guardrail rather than a slogan.
The following shortcuts are especially weak:
- Selecting a winner solely because it is ranked higher.
- Using total points without opponent and game-state adjustments.
- Treating an undefeated record as proof of elite quality.
- Assuming home-field advantage is identical at every stadium.
- Betting after a line moves without identifying why it moved.
- Chasing a loss with a larger stake.
- Copying a social-media prediction without checking the source date.
One more issue deserves attention: data freshness. A schedule page can change television assignments, kickoff times, and venue details, while a news article may describe an outdated depth chart. Before publishing or acting on a college football prediction, check the date, source, and whether the information refers to the current season. NCAA.com’s 2026 coverage identifies major CFP milestones, including the January 25, 2027 championship date at Allegiant Stadium, but postseason plans and broadcast details should still be verified as the season progresses. If a site cannot explain when its data was updated, discount its confidence. Accuracy is not only about using the right statistic; it is also about using the right version of that statistic.
Use the same filter for every matchup and the obvious narratives lose their power.
Frequently Asked Questions
Q: What is college football?
A: College football is American football played by university and college teams under governing structures such as the NCAA. The highest-profile competition is the FBS, while the FCS, Division II, and Division III operate with different schedules, scholarship models, and postseason systems. Teams compete during the regular season for conference success, rankings, bowl opportunities, or playoff qualification, depending on their division.
Q: How do I find the 2026 college football schedule?
A: Use ESPN for a consolidated schedule with conference filters, weekly views, television listings, venues, and postseason categories. The 2026 schedule format separates Week 1 through Week 15, bowl games, and CFP games, making it easier to isolate a team or conference. Confirm late kickoff, broadcast, and venue changes through the relevant conference or school website before relying on the information.
Q: What is the difference between FBS and FCS college football?
A: FBS and FCS are separate NCAA Division I football subdivisions with different postseason structures and competition formats. FBS teams generally compete for bowl placement and College Football Playoff access, while FCS teams compete in a bracketed national playoff system. The distinction affects scheduling, postseason qualification, scholarship administration, and how rankings should be interpreted.
Q: Are college football rankings accurate predictors?
A: Rankings are useful indicators of national perception and resume quality, but they are not precise game predictions. A ranking does not account perfectly for injuries, matchup styles, travel, weather, or recent improvement, and the difference between adjacent positions may be small. Combine rankings with opponent-adjusted efficiency, availability, schedule strength, and market information before forming a prediction.
Q: How can I analyze a college football matchup?
A: Start by comparing the last five games, opponent quality, scoring margin, yards per play, success rate, sack differential, turnovers, and red-zone performance. Then check quarterback and offensive-line availability, venue, travel, rest, weather, and the current spread or market price. Record your initial estimate before kickoff so you can evaluate the process honestly rather than changing the explanation after the result.
Q: Does a team scoring more points always have the better offense?
A: No, because scoring totals are affected by pace, opponent quality, field position, turnovers, special teams, and defensive touchdowns. A more reliable evaluation uses yards per play, success rate, explosive plays, pressure allowed, early-down efficiency, and red-zone touchdown rate. Separate competitive-game performance from garbage-time production before deciding whether the offense is genuinely strong.
Q: How much does college football betting analysis cost?
A: Basic schedule, scores, rankings, and many statistics are available free through sources such as NCAA.com, ESPN, conference websites, and team releases. Paid databases may charge monthly fees that commonly range from approximately $10 to $100 or more, depending on depth and access. No subscription guarantees profit, so set a research budget, verify data quality, and never increase a stake simply to recover a loss.
The next step is straightforward: track the 2026 schedule, verify the underlying numbers, and make every conclusion earn its confidence.
[Internal Link: frequently asked questions about college football analysis]